On April 15 2024, JIC BRO – the foundation responsible for the Industry Reach & Frequency research into Outdoor Advertising ((D)OOH) – launched the new industry standard BRO Next. The details of the new research are described on our website. Even before the launch, it was clear that the new research differed from the old research in so many facets that the outcomes could not be compared with each other. In this document we explain why.
New and more granular data
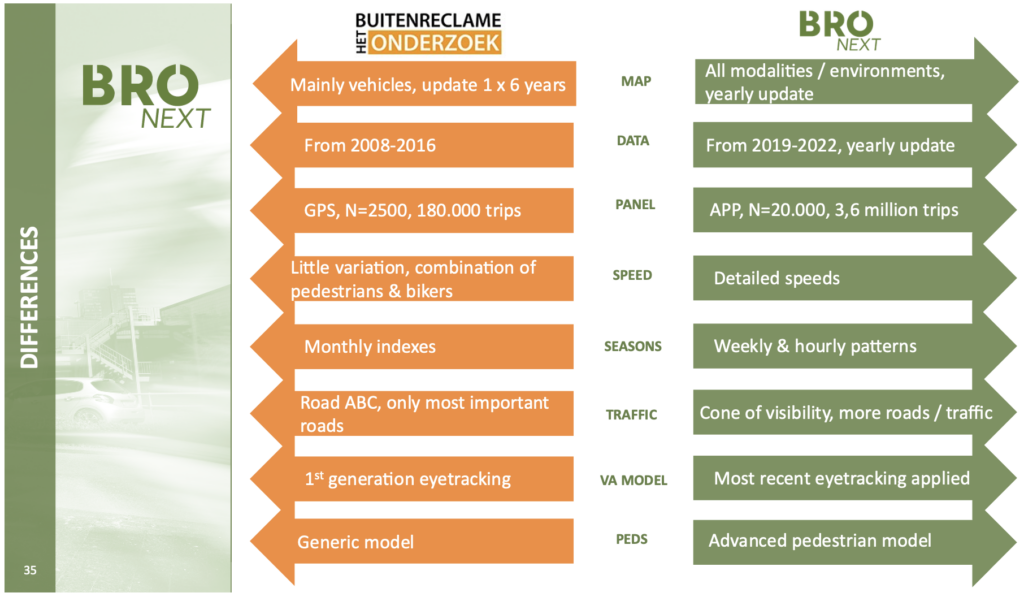
The old research was based on a now outdated set of data, while we currently use data collected and aggregated using the latest methods and information available. The diagram below gives a good overview of the differences. The data is recent, much more granular due to the larger volume, and is updated more often.
It is not possible to indicate how the differences in data ultimately influence the figures. It can differ per environment and per modality.
New (data collection) methods
Not only the data, but also the way the data is collected and the sources used have changed. While the old research collected the movements of people with a GPS meter once in 2008/2009, we now use an app and the measurement is continuous, allowing us to add new data every year.
Another part of the method that has changed is how we determine if a person is in the visibility area of an OOH object. Previously, this was estimated globally for all modalities and object types. In the new design, the objects are placed on the map of the Netherlands and all positions are transparently drawn from where someone can take a look at the object. This also informs the difference between OTS (opportunity to see), as applied before, and ROTS (realistic opportunity to see) as applied in the new research. For ROTS we include the way the object is positioned in relation to the route. In doing so, the reach is calculated for those who were actually able to see it. For digital objects the new research project applies D-ROTS instead of D-OTS.
The result is that on average more positions are included in the visibility area. This, together with the traffic intensity that has grown over the years, results in a higher number of contacts (ROTS, formerly OTS) for most objects than before.
Reach calculation and planning software
The way reach is calculated, across all different environments, modalities and objects, has also changed. The new research also provides a much greater variation in seasons and takes hourly patterns into account, because hourly figures are also provided for digital objects, where previously we only provided weekly totals. The consequence of this cannot be explained quantitatively, other than that the figures now correspond better with reality.
New visibility algorithm
In outdoor advertising Industry research, in addition to the opportunity to see (OTS), the factor whether or not you have looked at the object (VAC) plays a major role. In the old research we used the first generation of international visibility models, while now we use an updated model that uses newest insights based on research.
On average, this new model reduces visible contacts, so we have become slightly stricter. The consequence of this is that the reach of campaigns is also somewhat lower.
Different population
The population of BRO Next is 13+ years. Previously the population was 13-75 years.
As a result, the number of contacts increases slightly, but the reach decreases slightly, because the basis on which the reach is calculated is larger.
Other models
In the old research, state-of-the-art models were used for the time in which the research was set up. Now that we are several years ahead and have much more detailed data at our disposal, we know that they were quite general and coarse. This applied to pedestrian movements (based on questions about how often people came to a certain area or indoor location), but also, for example, to how people’s contacts were distributed across an indoor location. The model calculated how many people visited the location in an average week and that number was then divided by the number of entrances to approximate how many people saw an OOH object at the entrance. In the new research, the allocation is based on the traffic flows that bring people to the location and the app movements that are registered.
We cannot estimate the consequences of this based on the figures. We do know that the current calculation is more accurate.
New research partners
The old reach research was conducted by Simon Cooper & Associates, a research agency from the United Kingdom. The new research is carried out by a consortium consisting of (a.) Dutch mobility specialists who provide the data input (DAT.mobility), (b.) a Czech party specialized in Outdoor Advertising research (Ipsos OOH), who provide the software in which the objects are classified and the planning software and advises on this, and (c.) a German party that does the audience modeling (ISBA).
It is widely known that simply by changing the research agency, results between measurements can differ considerably. Here too, we cannot estimate the direction of the change.
Conclusion
There are so many differences in design and method between the old and the new method that the results cannot be compared. In addition, parts of the method will be further optimized in 2024. New environments and objects will be added every quarter. The technical committee is making further optimizations in a number of areas. For example, work is still being done on a further specification of speeds (for example: people drive slower in traffic jams and at a traffic lights) and on waiting times on platforms. 2024 should therefore be seen as a transition year, in which we can expect changes in the outcomes with every update.
For more information, please contact BRO Next.